Part I: Intro (Generic)#
Models#
Tapqir is a modular program that uses a chosen probabilistic model to interpret experimental data.
There currently exists only a single model, cosmos, developed for analysis of simple CoSMoS
experiments. The cosmos model is for time-independent analysis of single-channel (i.e., one-binder)
data sets. Our publication (Ordabayev et al., 2022) contains a comprehensive description of the
cosmos model. In the future, we plan to add addional models to Tapqir, for example to integrate
hidden-Markov kinetic analysis or to handle global analysis with multiple wavelength channels.
Tapqir uses Bayesian models; this means that each model parameter has an associated probability distribution (uncertainty). For those who are interested, Kinz-Thompson et al., 2021 is a nice read about Bayesian inference in the context of single-molecule data analysis.
As a consequence of Bayesian inference, Tapqir computes for each frame of each AOI the probability \(p(\mathsf{specific})\), that a target-specific spot is present.
cosmos is a physics-informed model, i.e. model parameters have a physical meaning.
For N AOIs per frame, F frames, and a maximum of K spots in each AOI in each frame,
Tapqir estimates the values of the cosmos model parameters:
Parameter |
Shape |
Description |
|---|---|---|
|
(1,) |
camera gain |
|
(1,) |
proximity |
|
(1,) |
average rate of target-nonspecific binding |
|
(1,) |
average binding probability of target-specific binding |
|
(N, F) |
background intensity |
|
(N, F) |
target-specific spot presence |
|
(N, F) |
target-specific spot index |
|
(K, N, F) |
spot presence indicator |
|
(K, N, F) |
spot intensity |
|
(K, N, F) |
spot width |
|
(K, N, F) |
spot position on x-axis |
|
(K, N, F) |
spot position on y-axis |
|
(N, F, P, P) |
observed images |
where “shape” is the dimensionality of the parameters, e.g., (1,) shape means a scalar parameter and (K, N, F) shape means that each spot in each AOI in each frame has a separate value of the parameter. Ordabayev et al., 2022 has a more detailed description of the parameters.
Some basic Linux commands#
For a quick reference, some commonly used Linux commands:
pwd- Print the name of the current working directory.ls- List files and folders.cd- Change the working directory (e.g.,cd Downloads)mkdir- Create a folder (e.g.,mkdir new_folder). Tip: try to avoid spaces in file & folder names because spaces need a special escape character\.rm- Delete files. Userm -rto delete folders. Be careful, files delted withrmcommand do not go to the recycle bin and are permanently deleted!cp- Copy files. Usage iscp <from> <to>.mv- Move or rename files. Usage ismv <from> <to>.Use double
[TAB]for command or filename completion.
Input data#
Tapqir analyzes a small area of interest (AOI) around each target or off-target location. AOIs (usually 14x14 pixels)
are extracted from raw input data. Currently Tapqir supports raw input images in Glimpse format and pre-processing
information files from the imscroll program:
folder containing image data in glimpse format and header files
driftlist file recording the stage movement that took place during the experiment
aoiinfo file designating target molecule locations in the binder channel
(optional) aoiinfo file designating off-target locations in the binder channel
We plan to extend the support to other data formats. Please start a new issue if you would like to work with us to extend support to file formats used in your processing pipeline.
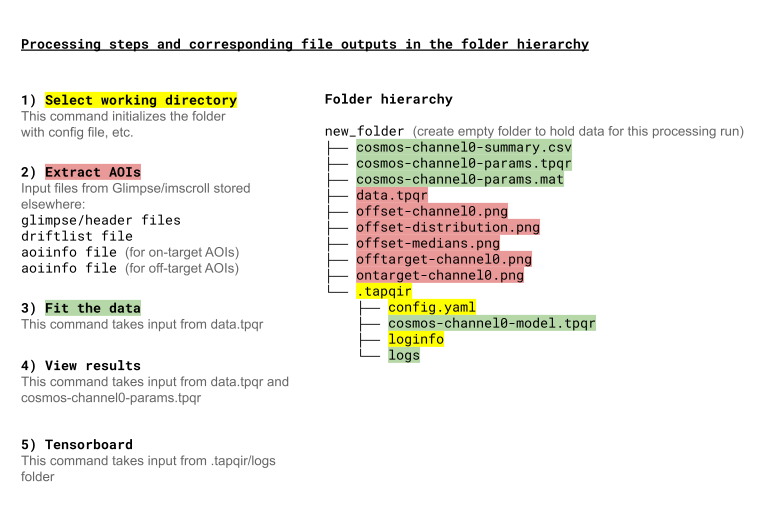
Workflow#
The following diagram shows the steps in a Tapqir data processing run (using the cosmos model), the Tapqir command
used to run each step, and the input files used and output files produced (color highlights) in each step. All the
Tapqir commands for a single processing run should be run in the same default working directory (new_folder in
the diagram) in order to keep the files associated with the run organized in a single location.